【案例07】慢跑者追逐问题 返回首页
作者:欧新宇(Xinyu OU)
当前版本:Release v1.0
开发平台:Python3.11
运行环境:Intel Core i7-7700K CPU 4.2GHz, nVidia GeForce GTX 1080 Ti
本教案所涉及的数据集仅用于教学和交流使用,请勿用作商用。
最后更新:2024年3月28日
【知识点】
微分方程
【问题描述】
一个慢跑者在平面上按如下规律跑步
突然有一只狗攻击他,这只狗从原点出发,以恒定速率 跑向慢跑者,狗运动方向始终指向慢跑者。分别求出 时,狗的运动轨迹。
【答案及解析】
一、问题分析及假设
根据题意,首先做如下定义:
- 设时刻 狗的坐标为 ,慢跑者坐标为 。
- 慢跑者的初始坐标以时刻 进行定义,狗的初始坐标为 。
- 狗的速度恒定为 ,并且始终指向慢跑者。
- 要求给定狗的速度 ,分别给出狗的运动轨迹。
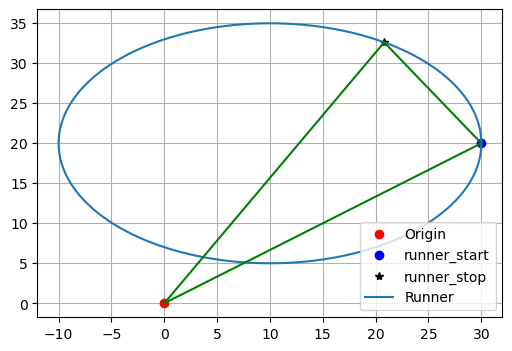
为了便于理解,我们首先绘制出狗和慢跑者的初始位置,同时给出慢跑者的运动曲线。
# Lec0408-1: 例8.10 初始状态
# 1. 绘制慢跑者随着t变化的运动轨迹
# 2. 绘制慢跑者、狗的初始位置、以及时刻t=1时慢跑者的位置
# 3. 绘制三个位置的距离连线

import matplotlib.pyplot as plt
import numpy as np

# 1. 定义慢跑者的位置方程
def runner_position(t):
    X = 10 + 20 * np.cos(t)
    Y = 20 + 15 * np.sin(t)
    return X, Y

dt = 0.01               # 时间步长
t_max = 2 * np.pi       # 时间周期,模拟慢跑者一圈的情况
t_vals = np.linspace(0, t_max, int(t_max / dt))                  # 定义周期时间点
runner_X, runner_Y = zip(*[runner_position(t) for t in t_vals])  # 生成慢跑者的轨迹坐标

# 2. 定义几个位置的坐标
x0, y0 = (0, 0)                                            # 狗的初始位置:原点
X0, Y0 = (runner_position(0)[0], runner_position(0)[1])    # 慢跑者的初始位置(t=0)
X1, Y1 = (runner_position(1)[0], runner_position(1)[1])    # 慢跑者t=1时的位置

# 3. 绘制慢跑者曲线方程以及慢跑者、狗的初始位置、以及时刻t=1时慢跑者的位置
plt.figure(figsize=(6, 4))
plt.plot(x0, y0, 'ro', label='Origin')
plt.plot(X0, Y0, 'bo', label='runner_start')
plt.plot(X1, Y1, 'k*', label='runner_stop')
plt.plot(runner_X, runner_Y, label='Runner')
plt.legend(loc="lower right")
plt.grid(True)

# 4. 绘制三个位置的距离连线
plt.plot((x0, X1), (y0, Y1), 'g-')
plt.plot((x0, X0), (y0, Y0), 'g-')
plt.plot((X0, X1), (Y0, Y1), 'g-')
plt.show()
二、模型建立
接下来,我们给出狗的运动轨迹计算模型。根据三角形的毕达哥拉斯定理,可以得到狗的速度 在 和 方向上的分量关系:
由于狗始终指向慢跑者,故狗的速度方向平行于狗与人位置的差向量,即:
将式(8.10.3)展开可得(8.10.4)得:
继续将(8.10.4)代入(8.10.2)并消去 后可以得到狗在 时刻的坐标位置:
将人的位置方程(8.10.1)代入(8.10.5)可得狗的运动轨迹方程:
三、编程求解
对于以上的运动轨迹方程,我们使用 odeint() 函数来求数值解。但为了进一步理解微元法,下面的代码我们通过定义狗和慢跑者关于时间 的坐标位置函数 runner_position() 和 dog_position() 来衡量两者之间的距离。也就是说,当 时,狗追上人。
在下面的代码中,我们通过定义一个数组变量 dist 来存储狗和慢跑者两者的距离,并判断 是否为0,若为0,则表示狗追上人。在实际代码编写中,由于慢跑者和狗的距离值较为敏感,因此,我们设置距离阈值 thres = 0.5,并以该阈值判断狗是否追上人。
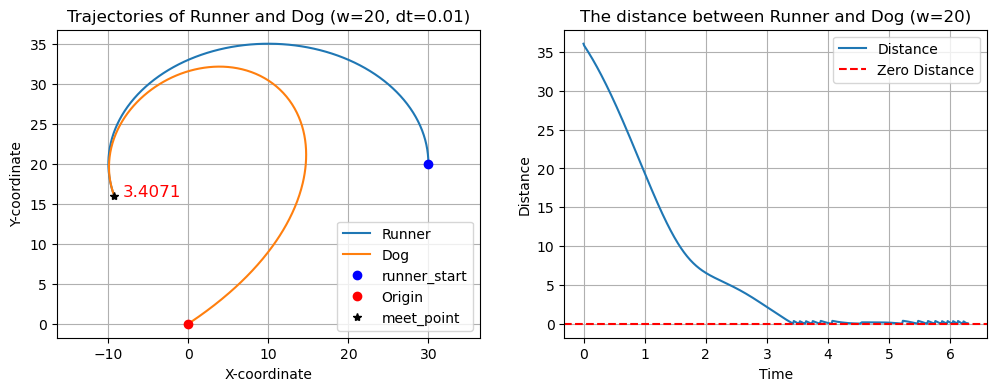
下面给出速度 时狗的运动轨迹曲线:
# Lec0408-2: 例8.10 慢跑者w=20
import numpy as np
import matplotlib.pyplot as plt

# 1. 定义慢跑者的位置方程
def runner_position(t):
    X = 10 + 20 * np.cos(t)
    Y = 20 + 15 * np.sin(t)
    return X, Y

# 2. 狗的运动方程
def dog_position(t, w, dt):
    # 2.1 定义狗初始位置
    dog_X, dog_Y = 0, 0
    for _t in np.arange(0, t+dt, dt):
        runner_X, runner_Y = runner_position(_t)  # 获取t时刻慢跑者的位置
        # 2.2 计算狗到慢跑者的向量
        direction_X = runner_X - dog_X            # 公式8.10.3
        direction_Y = runner_Y - dog_Y
        # 2.3 归一化向量以获取方向
        direction_norm = np.sqrt(direction_X**2 + direction_Y**2) # 公式8.10.2
        if direction_norm > 0:
            direction_X /= direction_norm         # 公式8.10.4
            direction_Y /= direction_norm
        # 2.4 更新狗的位置
        dog_X += w * dt * direction_X
        dog_Y += w * dt * direction_Y
        dist = direction_norm
    return dog_X, dog_Y, dist, _t


# 绘制慢跑者和狗的运动轨迹
def plot_trajectories(w, dt, t_max):
    t_vals = np.linspace(0, t_max, int(t_max / dt))  # 时间点
    thres = 0.1
    stop_id = -1
    runner_X, runner_Y = zip(*[runner_position(t) for t in t_vals])
    dog_X, dog_Y, dist, t = zip(*[dog_position(t, w, dt) for t in t_vals])
    try:
        stop_id = next(i for i, x in enumerate(dist) if x < thres)
    except:
        stop_id = -1
    t_meet = t_vals[stop_id]

    plt.figure(figsize=(12, 4))
    plt.subplot(121)
    plt.plot(runner_X[:stop_id], runner_Y[:stop_id], label='Runner')    # 慢跑者轨迹
    plt.plot(dog_X[:stop_id], dog_Y[:stop_id], label='Dog')             # 狗的轨迹
    plt.plot(runner_X[0], runner_Y[0], 'bo', label='runner_start')      # 慢跑者的起点
    plt.plot(0, 0, 'ro', label='Origin')                                # 狗的起点
    if stop_id != -1:                                                   # 当狗追不上时,不发生相遇
        plt.plot(dog_X[stop_id], dog_Y[stop_id], 'k*', label='meet_point')  # 相遇点
        plt.text(dog_X[stop_id]+1, dog_Y[stop_id], np.round(t_meet,4), fontsize=12, color='red')
    plt.axis('equal')  # 保持x轴和y轴的比例一致
    plt.grid(True)
    plt.legend()
    plt.title(f'Trajectories of Runner and Dog (w={w}, dt={dt})')
    plt.xlabel('X-coordinate')
    plt.ylabel('Y-coordinate')
    plt.subplot(122)
    plt.plot(t_vals, dist, label='Distance')
    plt.axhline(y=0, color='r', linestyle='--', label='Zero Distance')  # 标记距离为0的水平线
    plt.grid(True)
    plt.legend()
    plt.title(f'The distance between Runner and Dog (w={w})')
    plt.xlabel('Time')
    plt.ylabel('Distance')
    plt.show()

# 设置狗的速度和模拟参数
w = 20                  # 狗的速度
dt = 0.01               # 时间步长
t_max = 2 * np.pi       # 时间周期,模拟慢跑者一圈的情况

# 绘制轨迹
plot_trajectories(w, dt, t_max)
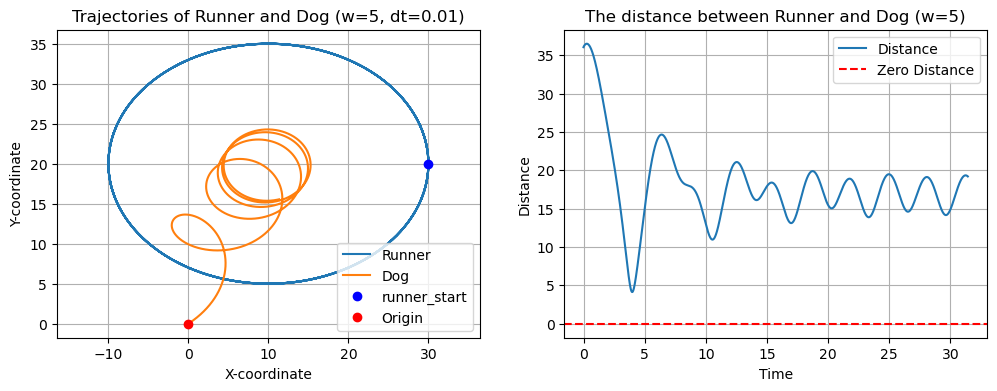
以下是速度 时狗的运动轨迹曲线:
# Lec0408-3: 例8.10 慢跑者w=5

# 设置狗的速度和模拟参数
w = 5                  # 狗的速度
dt = 0.01               # 时间步长
t_max = 5 * 2 * np.pi       # 时间周期,模拟慢跑者一圈的情况

# 绘制轨迹
plot_trajectories(w, dt, t_max)
以下是速度 时狗的运动轨迹曲线:
# Lec0408-4: 例8.10 慢跑者w=10

# 设置狗的速度和模拟参数
w = 10                  # 狗的速度
dt = 0.01               # 时间步长
t_max = 5 * 2 * np.pi       # 时间周期,模拟慢跑者一圈的情况

# 绘制轨迹
plot_trajectories(w, dt, t_max)
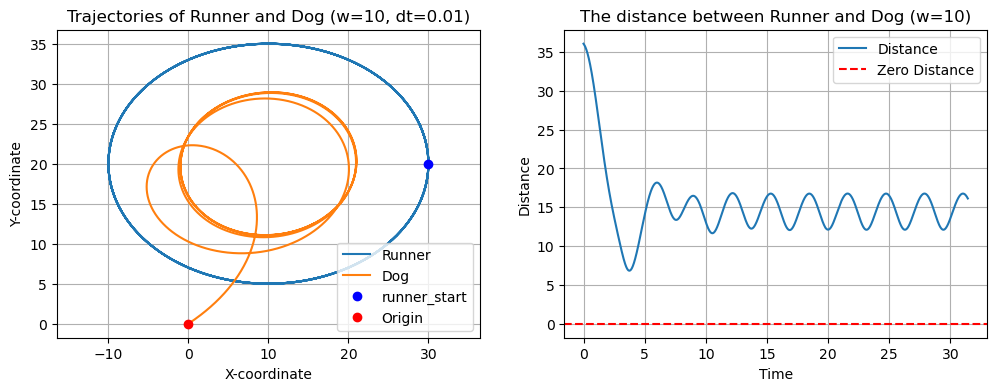
对上面的结果做一个总结,当狗的速度为 时,狗在 时,追上慢跑者,而当狗的速度为 时,甚至是 时,狗都始终无法追上慢跑者。
【拓展练习】
进一步推广,
- 我们可以衡量狗的速度 在什么范围内能够追上慢跑者;
- 为了保证慢跑者不被狗追上,慢跑者应该如何调整他自己的速度等
请读者自行尝试。